Global monthly temperature records in ERA5
Where have monthly average temperatures broken records across the world in 2020?
In this first section, we load required packages and modules
[29]:
##This is so variables get printed within jupyter
from IPython.core.interactiveshell import InteractiveShell
InteractiveShell.ast_node_interactivity = "all"
[2]:
##import packages
import os
import xarray as xr
import numpy as np
import matplotlib.pyplot as plt
import cartopy
import cartopy.crs as ccrs
import matplotlib.ticker as mticker

#for rank calculation
import bottleneck
[3]:
## this is to load our own function to retrieve ERA5,
## which is located in ../src/CDSretrieve.py
import sys
sys.path.append('../')
[4]:
##And here we load the module
import src.CDSretrieve as retrieve
[5]:
##We want the working directory to be the UNSEEN-open directory
pwd = os.getcwd() ##current working directory is UNSEEN-open/Notebooks/1.Download
pwd #print the present working directory
os.chdir(pwd+'/../') # Change the working directory to UNSEEN-open
os.getcwd() #print the working directory
[5]:
'/lustre/soge1/projects/ls/personal/timo/UNSEEN-open/Notebooks'
[5]:
'/lustre/soge1/projects/ls/personal/timo/UNSEEN-open'
Download ERA5
This section describes the retrieval of ERA5. We retrieve netcdf files of global monthly 2m temperature and 2m dewpoint temperature for each year over 1979-2020.
[39]:
retrieve.retrieve_ERA5(variables = ['2m_temperature','2m_dewpoint_temperature'], folder = '../Siberia_example/')
;
[39]:
''
We load all files with xarray open_mfdataset. The latest 3 months in this dataset are made available through ERA5T, which might be slightly different to ERA5. In the downloaded file, an extra dimenions ‘expver’ indicates which data is ERA5 (expver = 1) and which is ERA5T (expver = 5). After retrieving and loading, I combine both ERA5 and ERA5T to create a dataset that runs until August 2020.
[10]:
ERA5 = xr.open_mfdataset('../Siberia_example/ERA5_????.nc',combine='by_coords') ## open the data
ERA5#
[10]:
- expver: 2
- latitude: 181
- longitude: 360
- time: 500
- latitude(latitude)float3290.0 89.0 88.0 ... -89.0 -90.0
- units :
- degrees_north
- long_name :
- latitude
array([ 90., 89., 88., 87., 86., 85., 84., 83., 82., 81., 80., 79., 78., 77., 76., 75., 74., 73., 72., 71., 70., 69., 68., 67., 66., 65., 64., 63., 62., 61., 60., 59., 58., 57., 56., 55., 54., 53., 52., 51., 50., 49., 48., 47., 46., 45., 44., 43., 42., 41., 40., 39., 38., 37., 36., 35., 34., 33., 32., 31., 30., 29., 28., 27., 26., 25., 24., 23., 22., 21., 20., 19., 18., 17., 16., 15., 14., 13., 12., 11., 10., 9., 8., 7., 6., 5., 4., 3., 2., 1., 0., -1., -2., -3., -4., -5., -6., -7., -8., -9., -10., -11., -12., -13., -14., -15., -16., -17., -18., -19., -20., -21., -22., -23., -24., -25., -26., -27., -28., -29., -30., -31., -32., -33., -34., -35., -36., -37., -38., -39., -40., -41., -42., -43., -44., -45., -46., -47., -48., -49., -50., -51., -52., -53., -54., -55., -56., -57., -58., -59., -60., -61., -62., -63., -64., -65., -66., -67., -68., -69., -70., -71., -72., -73., -74., -75., -76., -77., -78., -79., -80., -81., -82., -83., -84., -85., -86., -87., -88., -89., -90.], dtype=float32) - longitude(longitude)float32-180.0 -179.0 ... 178.0 179.0
- units :
- degrees_east
- long_name :
- longitude
array([-180., -179., -178., ..., 177., 178., 179.], dtype=float32)
- expver(expver)int321 5
- long_name :
- expver
array([1, 5], dtype=int32)
- time(time)datetime64[ns]1979-01-01 ... 2020-08-01
- long_name :
- time
array(['1979-01-01T00:00:00.000000000', '1979-02-01T00:00:00.000000000',
       '1979-03-01T00:00:00.000000000', ..., '2020-06-01T00:00:00.000000000',
       '2020-07-01T00:00:00.000000000', '2020-08-01T00:00:00.000000000'],
      dtype='datetime64[ns]')
- t2m(time, latitude, longitude, expver)float32dask.array<chunksize=(12, 181, 360, 2), meta=np.ndarray>
- units :
- K
- long_name :
- 2 metre temperature
Array Chunk Bytes 260.64 MB 6.26 MB Shape (500, 181, 360, 2) (12, 181, 360, 2) Count 209 Tasks 42 Chunks Type float32 numpy.ndarray - d2m(time, latitude, longitude, expver)float32dask.array<chunksize=(12, 181, 360, 2), meta=np.ndarray>
- units :
- K
- long_name :
- 2 metre dewpoint temperature
Array Chunk Bytes 260.64 MB 6.26 MB Shape (500, 181, 360, 2) (12, 181, 360, 2) Count 209 Tasks 42 Chunks Type float32 numpy.ndarray
- Conventions :
- CF-1.6
- history :
- 2020-09-07 10:14:42 GMT by grib_to_netcdf-2.16.0: /opt/ecmwf/eccodes/bin/grib_to_netcdf -S param -o /cache/data3/adaptor.mars.internal-1599473651.1990857-24563-8-be8219b1-4396-4b61-90fe-4f688ea35d84.nc /cache/tmp/be8219b1-4396-4b61-90fe-4f688ea35d84-adaptor.mars.internal-1599473651.199597-24563-2-tmp.grib
[14]:
ERA5_combine =ERA5.sel(expver=1).combine_first(ERA5.sel(expver=5))
ERA5_combine.load()
[14]:
- latitude: 181
- longitude: 360
- time: 500
- latitude(latitude)float3290.0 89.0 88.0 ... -89.0 -90.0
- units :
- degrees_north
- long_name :
- latitude
array([ 90., 89., 88., 87., 86., 85., 84., 83., 82., 81., 80., 79., 78., 77., 76., 75., 74., 73., 72., 71., 70., 69., 68., 67., 66., 65., 64., 63., 62., 61., 60., 59., 58., 57., 56., 55., 54., 53., 52., 51., 50., 49., 48., 47., 46., 45., 44., 43., 42., 41., 40., 39., 38., 37., 36., 35., 34., 33., 32., 31., 30., 29., 28., 27., 26., 25., 24., 23., 22., 21., 20., 19., 18., 17., 16., 15., 14., 13., 12., 11., 10., 9., 8., 7., 6., 5., 4., 3., 2., 1., 0., -1., -2., -3., -4., -5., -6., -7., -8., -9., -10., -11., -12., -13., -14., -15., -16., -17., -18., -19., -20., -21., -22., -23., -24., -25., -26., -27., -28., -29., -30., -31., -32., -33., -34., -35., -36., -37., -38., -39., -40., -41., -42., -43., -44., -45., -46., -47., -48., -49., -50., -51., -52., -53., -54., -55., -56., -57., -58., -59., -60., -61., -62., -63., -64., -65., -66., -67., -68., -69., -70., -71., -72., -73., -74., -75., -76., -77., -78., -79., -80., -81., -82., -83., -84., -85., -86., -87., -88., -89., -90.], dtype=float32) - longitude(longitude)float32-180.0 -179.0 ... 178.0 179.0
- units :
- degrees_east
- long_name :
- longitude
array([-180., -179., -178., ..., 177., 178., 179.], dtype=float32)
- time(time)datetime64[ns]1979-01-01 ... 2020-08-01
- long_name :
- time
array(['1979-01-01T00:00:00.000000000', '1979-02-01T00:00:00.000000000',
       '1979-03-01T00:00:00.000000000', ..., '2020-06-01T00:00:00.000000000',
       '2020-07-01T00:00:00.000000000', '2020-08-01T00:00:00.000000000'],
      dtype='datetime64[ns]')
- t2m(time, latitude, longitude)float32244.7074 244.7074 ... 214.79857
- units :
- K
- long_name :
- 2 metre temperature
array([[[244.7074 , 244.7074 , 244.7074 , ..., 244.7074 , 244.7074 , 244.7074 ], [244.42686, 244.4086 , 244.39035, ..., 244.46837, 244.45508, 244.44014], [244.88667, 244.88168, 244.87338, ..., 244.9431 , 244.9265 , 244.90659], ..., [242.26729, 242.337 , 242.40009, ..., 242.0764 , 242.12619, 242.19757], [241.50372, 241.53027, 241.55518, ..., 241.41907, 241.44728, 241.4755 ], [242.92795, 242.92795, 242.92795, ..., 242.92795, 242.92795, 242.92795]], [[241.44562, 241.44562, 241.44562, ..., 241.44562, 241.44562, 241.44562], [240.8331 , 240.81152, 240.78995, ..., 240.8663 , 240.85468, 240.84473], [240.3484 , 240.33844, 240.32683, ..., 240.4231 , 240.39986, 240.3733 ], ..., [235.54123, 235.63916, 235.73047, ..., 235.21754, 235.32378, 235.435 ], [233.12436, 233.15092, 233.17914, ..., 232.97995, 233.02643, 233.07457], [234.14522, 234.14522, 234.14522, ..., 234.14522, 234.14522, 234.14522]], [[246.76073, 246.76073, 246.76073, ..., 246.76073, 246.76073, 246.76073], [246.30093, 246.29596, 246.29263, ..., 246.29596, 246.29596, 246.29927], [245.97392, 245.98056, 245.9872 , ..., 245.99384, 245.9872 , 245.98056], ..., [230.69754, 230.77556, 230.84859, ..., 230.49005, 230.54483, 230.62119], [227.83083, 227.83913, 227.84743, ..., 227.77771, 227.79431, 227.81256], [227.91382, 227.91382, 227.91382, ..., 227.91382, 227.91382, 227.91382]], ..., [[273.7372 , 273.7372 , 273.7372 , ..., 273.7372 , 273.7372 , 273.7372 ], [273.6449 , 273.6449 , 273.64816, ..., 273.65787, 273.653 , 273.64978], [273.69995, 273.69833, 273.69672, ..., 273.68863, 273.68863, 273.6951 ], ..., [227.0798 , 227.18506, 227.28543, ..., 226.75113, 226.83856, 226.96161], [222.94612, 222.95422, 222.9607 , ..., 222.88783, 222.90726, 222.9267 ], [223.5452 , 223.5452 , 223.5452 , ..., 223.5452 , 223.5452 , 223.5452 ]], [[274.1614 , 274.1614 , 274.1614 , ..., 274.1614 , 274.1614 , 274.1614 ], [274.12256, 274.12418, 274.1258 , ..., 274.13715, 274.13226, 274.1258 ], [274.20676, 274.20514, 274.2019 , ..., 274.2019 , 274.19867, 274.2019 ], ..., [222.21588, 222.3357 , 222.45065, ..., 221.86453, 221.95844, 222.0896 ], [218.76709, 218.7687 , 218.7687 , ..., 218.64404, 218.68452, 218.72662], [218.6489 , 218.6489 , 218.6489 , ..., 218.6489 , 218.6489 , 218.6489 ]], [[273.53482, 273.53482, 273.53482, ..., 273.53482, 273.53482, 273.53482], [273.5267 , 273.52832, 273.52832, ..., 273.53644, 273.53156, 273.52994], [273.57367, 273.57205, 273.56882, ..., 273.57367, 273.56882, 273.57205], ..., [221.32373, 221.45003, 221.5747 , ..., 220.88657, 221.02419, 221.17477], [215.54337, 215.53204, 215.5207 , ..., 215.51746, 215.52718, 215.5369 ], [214.79857, 214.79857, 214.79857, ..., 214.79857, 214.79857, 214.79857]]], dtype=float32) - d2m(time, latitude, longitude)float32241.76836 241.76836 ... 211.0198
- units :
- K
- long_name :
- 2 metre dewpoint temperature
array([[[241.76836, 241.76836, 241.76836, ..., 241.76836, 241.76836,
         241.76836],
        [241.52267, 241.50885, 241.49504, ..., 241.57181, 241.55339,
         241.53802],
        [242.01097, 242.0033 , 241.99255, ..., 242.07086, 242.04936,
         242.0294 ],
        ...,
        [238.93071, 238.99673, 239.06276, ..., 238.76488, 238.8094 ,
         238.8693 ],
        [238.2996 , 238.32265, 238.34721, ..., 238.22284, 238.24893,
         238.27504],
        [239.42055, 239.42055, 239.42055, ..., 239.42055, 239.42055,
         239.42055]],

       [[238.25815, 238.25815, 238.25815, ..., 238.25815, 238.25815,
         238.25815],
        [237.63933, 237.61937, 237.59941, ..., 237.68387, 237.6685 ,
         237.65161],
        [237.17253, 237.15257, 237.13107, ..., 237.26312, 237.23242,
         237.20325],
        ...,
        [232.30031, 232.4078 , 232.51529, ..., 232.0101 , 232.10684,
         232.20511],
        [229.7145 , 229.73752, 229.76208, ..., 229.5763 , 229.62082,
         229.66843],
        [230.39319, 230.39319, 230.39319, ..., 230.39319, 230.39319,
         230.39319]],

       [[243.83824, 243.83824, 243.83824, ..., 243.83824, 243.83824,
         243.83824],
        [243.37451, 243.36992, 243.36838, ..., 243.3822 , 243.38066,
         243.37605],
        [243.08891, 243.08891, 243.08737, ..., 243.12883, 243.11502,
         243.10274],
        ...,
        [226.94287, 227.02118, 227.09335, ..., 226.74171, 226.79391,
         226.8707 ],
        [224.07297, 224.08064, 224.08832, ..., 224.01923, 224.03766,
         224.05608],
        [224.08064, 224.08064, 224.08064, ..., 224.08064, 224.08064,
         224.08064]],

       ...,

       [[272.77475, 272.77475, 272.77475, ..., 272.77475, 272.77475,
         272.77475],
        [272.66974, 272.67123, 272.67123, ..., 272.6594 , 272.6609 ,
         272.6653 ],
        [272.76733, 272.76883, 272.7703 , ..., 272.74664, 272.75552,
         272.76144],
        ...,
        [223.10846, 223.21198, 223.31105, ..., 222.80237, 222.88666,
         222.99904],
        [219.37021, 219.37761, 219.38353, ..., 219.3081 , 219.32881,
         219.351  ],
        [219.93805, 219.93805, 219.93805, ..., 219.93805, 219.93805,
         219.93805]],

       [[273.8749 , 273.8749 , 273.8749 , ..., 273.8749 , 273.8749 ,
         273.8749 ],
        [273.85568, 273.85568, 273.85275, ..., 273.85864, 273.85718,
         273.85568],
        [273.89413, 273.89267, 273.8897 , ..., 273.89413, 273.89413,
         273.89413],
        ...,
        [218.273  , 218.3839 , 218.49185, ..., 217.9388 , 218.02753,
         218.15173],
        [215.0523 , 215.05379, 215.05823, ..., 214.92958, 214.97098,
         215.01091],
        [214.8586 , 214.8586 , 214.8586 , ..., 214.8586 , 214.8586 ,
         214.8586 ]],

       [[273.13556, 273.13556, 273.13556, ..., 273.13556, 273.13556,
         273.13556],
        [273.11188, 273.11188, 273.11188, ..., 273.11633, 273.11633,
         273.11484],
        [273.06015, 273.05423, 273.0483 , ..., 273.06754, 273.06604,
         273.0616 ],
        ...,
        [217.46117, 217.58687, 217.70663, ..., 217.04416, 217.17874,
         217.32364],
        [211.87007, 211.85973, 211.8479 , ..., 211.83458, 211.8464 ,
         211.85825],
        [211.0198 , 211.0198 , 211.0198 , ..., 211.0198 , 211.0198 ,
         211.0198 ]]], dtype=float32)
- Conventions :
- CF-1.6
- history :
- 2020-09-07 10:14:42 GMT by grib_to_netcdf-2.16.0: /opt/ecmwf/eccodes/bin/grib_to_netcdf -S param -o /cache/data3/adaptor.mars.internal-1599473651.1990857-24563-8-be8219b1-4396-4b61-90fe-4f688ea35d84.nc /cache/tmp/be8219b1-4396-4b61-90fe-4f688ea35d84-adaptor.mars.internal-1599473651.199597-24563-2-tmp.grib
Calculating the rank
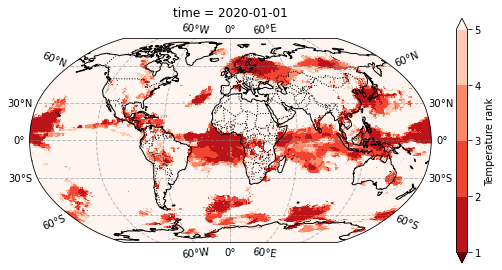
We want to show for each month whether the recorded monthly average temperature for 2020 is the highest since 1979 (or second highest, etc.).
We first select only January months.
[15]:
ERA5_jan = ERA5_combine.sel(time=ERA5_combine['time.month'] == 1) ## Select only for the i month
Then we calculate the rank of January average temperatures over the years. We rename the variable ‘t2m’ into ‘Temperature rank’.
[16]:
ERA5_jan_rank = ERA5_jan['t2m'].rank(dim = 'time')
ERA5_jan_rank = ERA5_jan_rank.rename('Temperature rank')
We now have calculated the rank in increasing order, i.e. the highest values has the highest rank. However, we want to show the highest rank being number 1, the second highest being number 2. Therefore, we invert the ranks and then we select the inverted rank of January 2020 average temperature within the January average temperatures of the other years. If January 2020 average temperature would be highest on record, the inverted rank will be 1. Second highest will be 2.
[17]:
ERA5_jan_rank_inverted = (len(ERA5_jan_rank.time) - ERA5_jan_rank + 1).sel(time='2020')
ERA5_jan_rank_inverted
[17]:
- time: 1
- latitude: 181
- longitude: 360
- 25.0 25.0 25.0 25.0 25.0 25.0 25.0 ... 24.0 24.0 24.0 24.0 24.0 24.0
array([[[25., 25., 25., ..., 25., 25., 25.], [23., 23., 23., ..., 23., 23., 23.], [25., 25., 25., ..., 25., 25., 25.], ..., [23., 23., 23., ..., 23., 23., 23.], [24., 24., 24., ..., 24., 24., 24.], [24., 24., 24., ..., 24., 24., 24.]]]) - latitude(latitude)float3290.0 89.0 88.0 ... -89.0 -90.0
- units :
- degrees_north
- long_name :
- latitude
array([ 90., 89., 88., 87., 86., 85., 84., 83., 82., 81., 80., 79., 78., 77., 76., 75., 74., 73., 72., 71., 70., 69., 68., 67., 66., 65., 64., 63., 62., 61., 60., 59., 58., 57., 56., 55., 54., 53., 52., 51., 50., 49., 48., 47., 46., 45., 44., 43., 42., 41., 40., 39., 38., 37., 36., 35., 34., 33., 32., 31., 30., 29., 28., 27., 26., 25., 24., 23., 22., 21., 20., 19., 18., 17., 16., 15., 14., 13., 12., 11., 10., 9., 8., 7., 6., 5., 4., 3., 2., 1., 0., -1., -2., -3., -4., -5., -6., -7., -8., -9., -10., -11., -12., -13., -14., -15., -16., -17., -18., -19., -20., -21., -22., -23., -24., -25., -26., -27., -28., -29., -30., -31., -32., -33., -34., -35., -36., -37., -38., -39., -40., -41., -42., -43., -44., -45., -46., -47., -48., -49., -50., -51., -52., -53., -54., -55., -56., -57., -58., -59., -60., -61., -62., -63., -64., -65., -66., -67., -68., -69., -70., -71., -72., -73., -74., -75., -76., -77., -78., -79., -80., -81., -82., -83., -84., -85., -86., -87., -88., -89., -90.], dtype=float32) - longitude(longitude)float32-180.0 -179.0 ... 178.0 179.0
- units :
- degrees_east
- long_name :
- longitude
array([-180., -179., -178., ..., 177., 178., 179.], dtype=float32)
- time(time)datetime64[ns]2020-01-01
- long_name :
- time
array(['2020-01-01T00:00:00.000000000'], dtype='datetime64[ns]')
Plotting
We define a function to plot the data on a global map:
[18]:
def Global_plot(ERA5_i_rank_inverted):
    fig, ax = plt.subplots(figsize=(9, 4.5))
    ax = plt.axes(projection=ccrs.Robinson())
    ERA5_i_rank_inverted.plot(
        ax=ax,
        transform=ccrs.PlateCarree(),
        levels=[1, 2, 3, 4, 5],
        extend='both',
        colors=plt.cm.Reds_r)

    ax.add_feature(cartopy.feature.BORDERS, linestyle=':')
    ax.coastlines(
        resolution='110m')  #Currently can be one of “110m”, “50m”, and “10m”.
    gl = ax.gridlines(crs=ccrs.PlateCarree(),
                      draw_labels=True,
                      linewidth=1,
                      color='gray',
                      alpha=0.5,
                      linestyle='--')
#     gl.top_labels = False
#     gl.right_labels = False
And plot!
[19]:
Global_plot(ERA5_jan_rank_inverted)
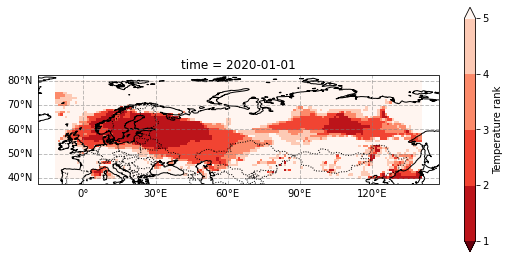
And zoom in for Siberia. We define a new plot:
[55]:
def Siberia_plot(ERA5_i_rank_inverted):
    fig, ax = plt.subplots(figsize=(9, 4.5))
    ax = plt.axes(projection=ccrs.PlateCarree(central_longitude=50.0))
    ERA5_i_rank_inverted.plot(
        ax=ax,
        transform=ccrs.PlateCarree(),
        levels=[1, 2, 3, 4, 5],
        extend='both',
        colors=plt.cm.Reds_r)

    ax.add_feature(cartopy.feature.BORDERS, linestyle=':')
    ax.coastlines(resolution='50m')
    gl = ax.gridlines(crs=ccrs.PlateCarree(),
                      draw_labels=True,
                      linewidth=1,
                      color='gray',
                      alpha=0.5,
                      linestyle='--')
    gl.top_labels = False
    gl.right_labels = False
[56]:
Siberia_plot(ERA5_jan_rank_inverted.sel(longitude = slice(-11,140), latitude = slice(80,40)))
Loop over Jan-Aug
Create the gif
We use ImageMagick and run it from the command line. See this CMS notebook for more info on creating gifs.
[58]:
!convert -delay 60 ../Siberia_example/plots/Global*png graphs/Global_Animation_01.gif
[60]:
!convert -delay 60 ../Siberia_example/plots/Siberia*png graphs/Siberia_Animation_01.gif
And show the gif in jupyter notebook with

Same for the Siberian temperature records: